Your market, run live: not a slide deck
Point Markets at a NAICS code or a contract you are tracking and pull the market live: what is expiring, who holds it, who else is winning at those buyers, and where your recompetes land. Eight views of one market, built from 35.9M real prime award transactions. 22GB of warehouse, not a sample.
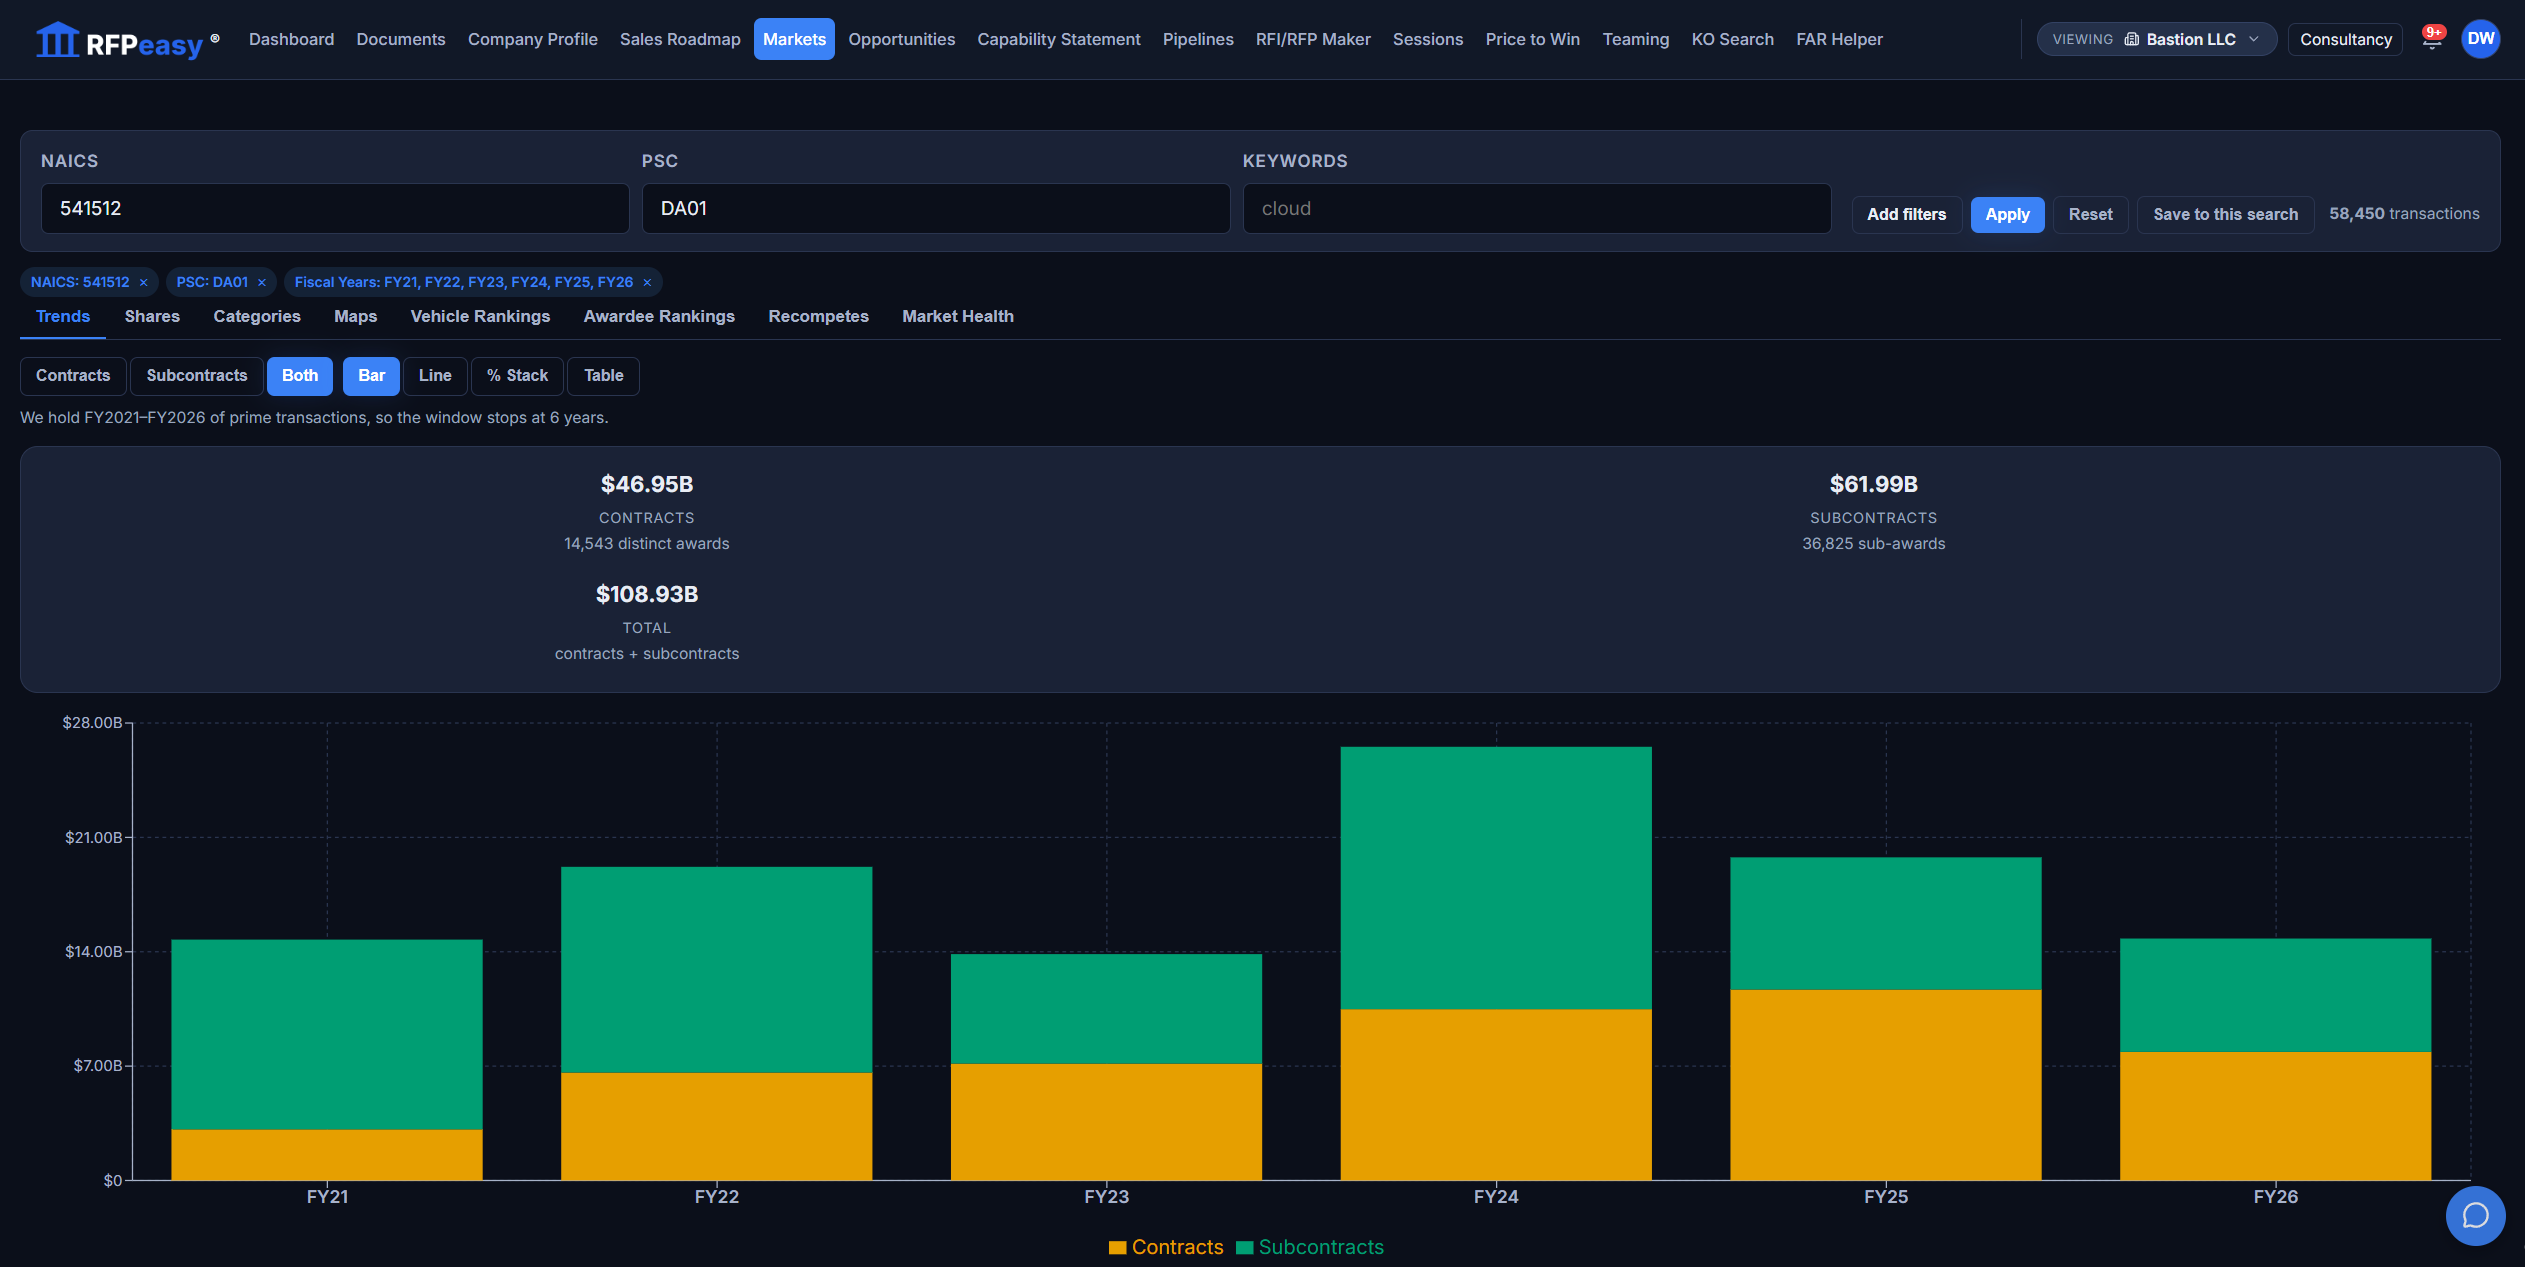
Market research means forty browser tabs on USAspending and a spreadsheet you stopped trusting last month.
How big is this market, actually, and is it growing?
Which agencies buy it, and through which sub-agencies?
Who keeps winning, and who just broke in?
What is expiring in the next 24 months?
Which contract vehicles carry the money?
How much of it is set aside, and how much do small firms actually win?
How many bidders does an award here really face?
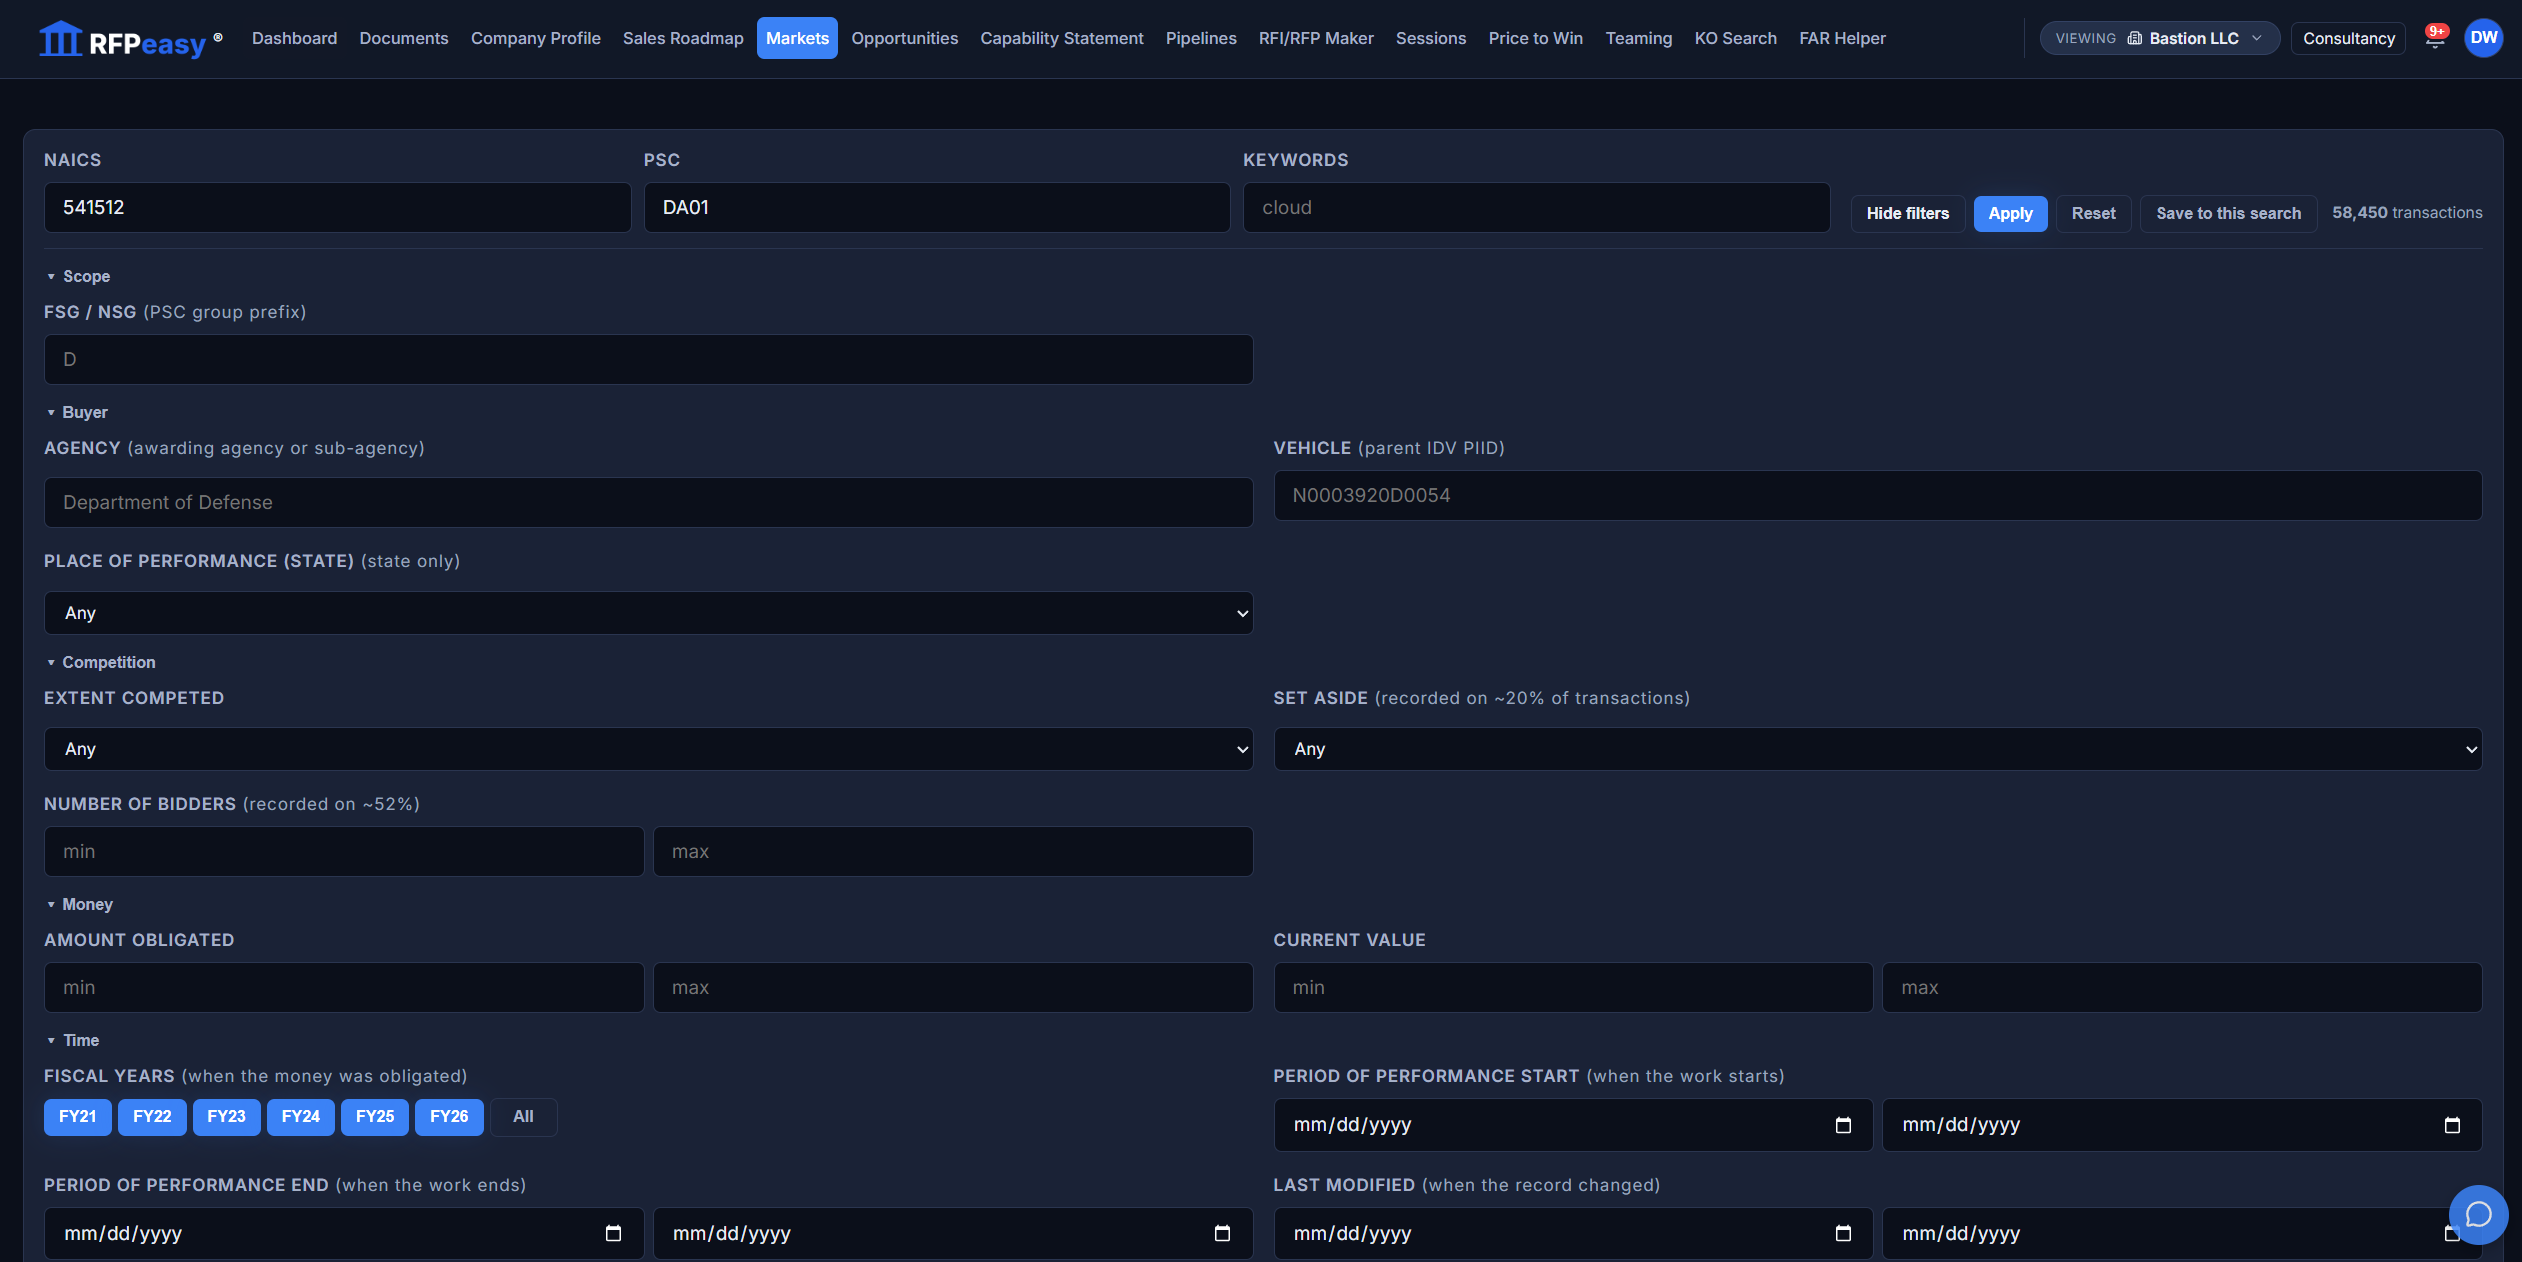
Define the market once. Every view answers about the same market.
NAICS, PSC, keywords, agency, vehicle, place of performance, set-aside, competition type, bidder counts, dollar ranges, dates: seventeen filters, and every one applies to all eight views at once. Pick fiscal years individually across FY2021-FY2026. Save the search and it reopens exactly as you left it.
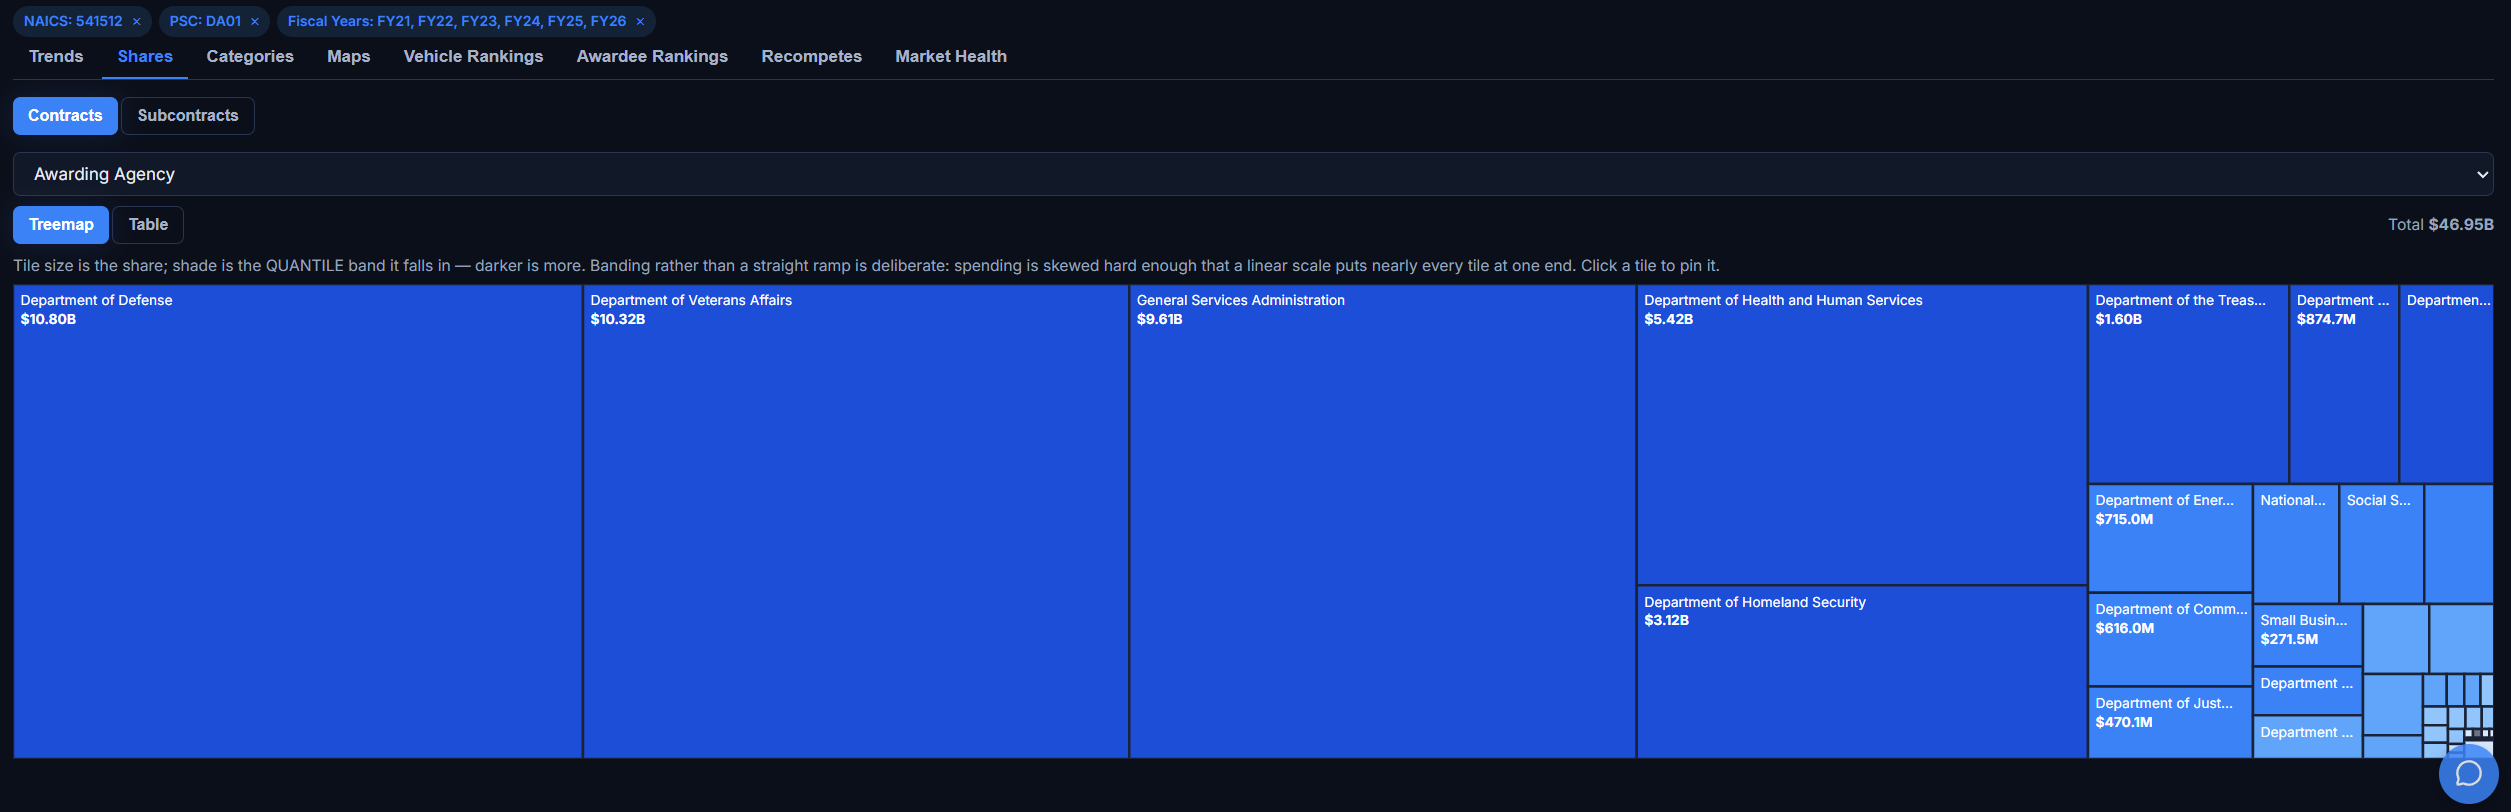
See who the money actually flows through.
One treemap of the whole market by agency, sub-agency, vehicle, or winner, sized by share, so the first glance tells you whether this is one buyer’s market or twenty. Click any tile to pin its exact dollars and share.
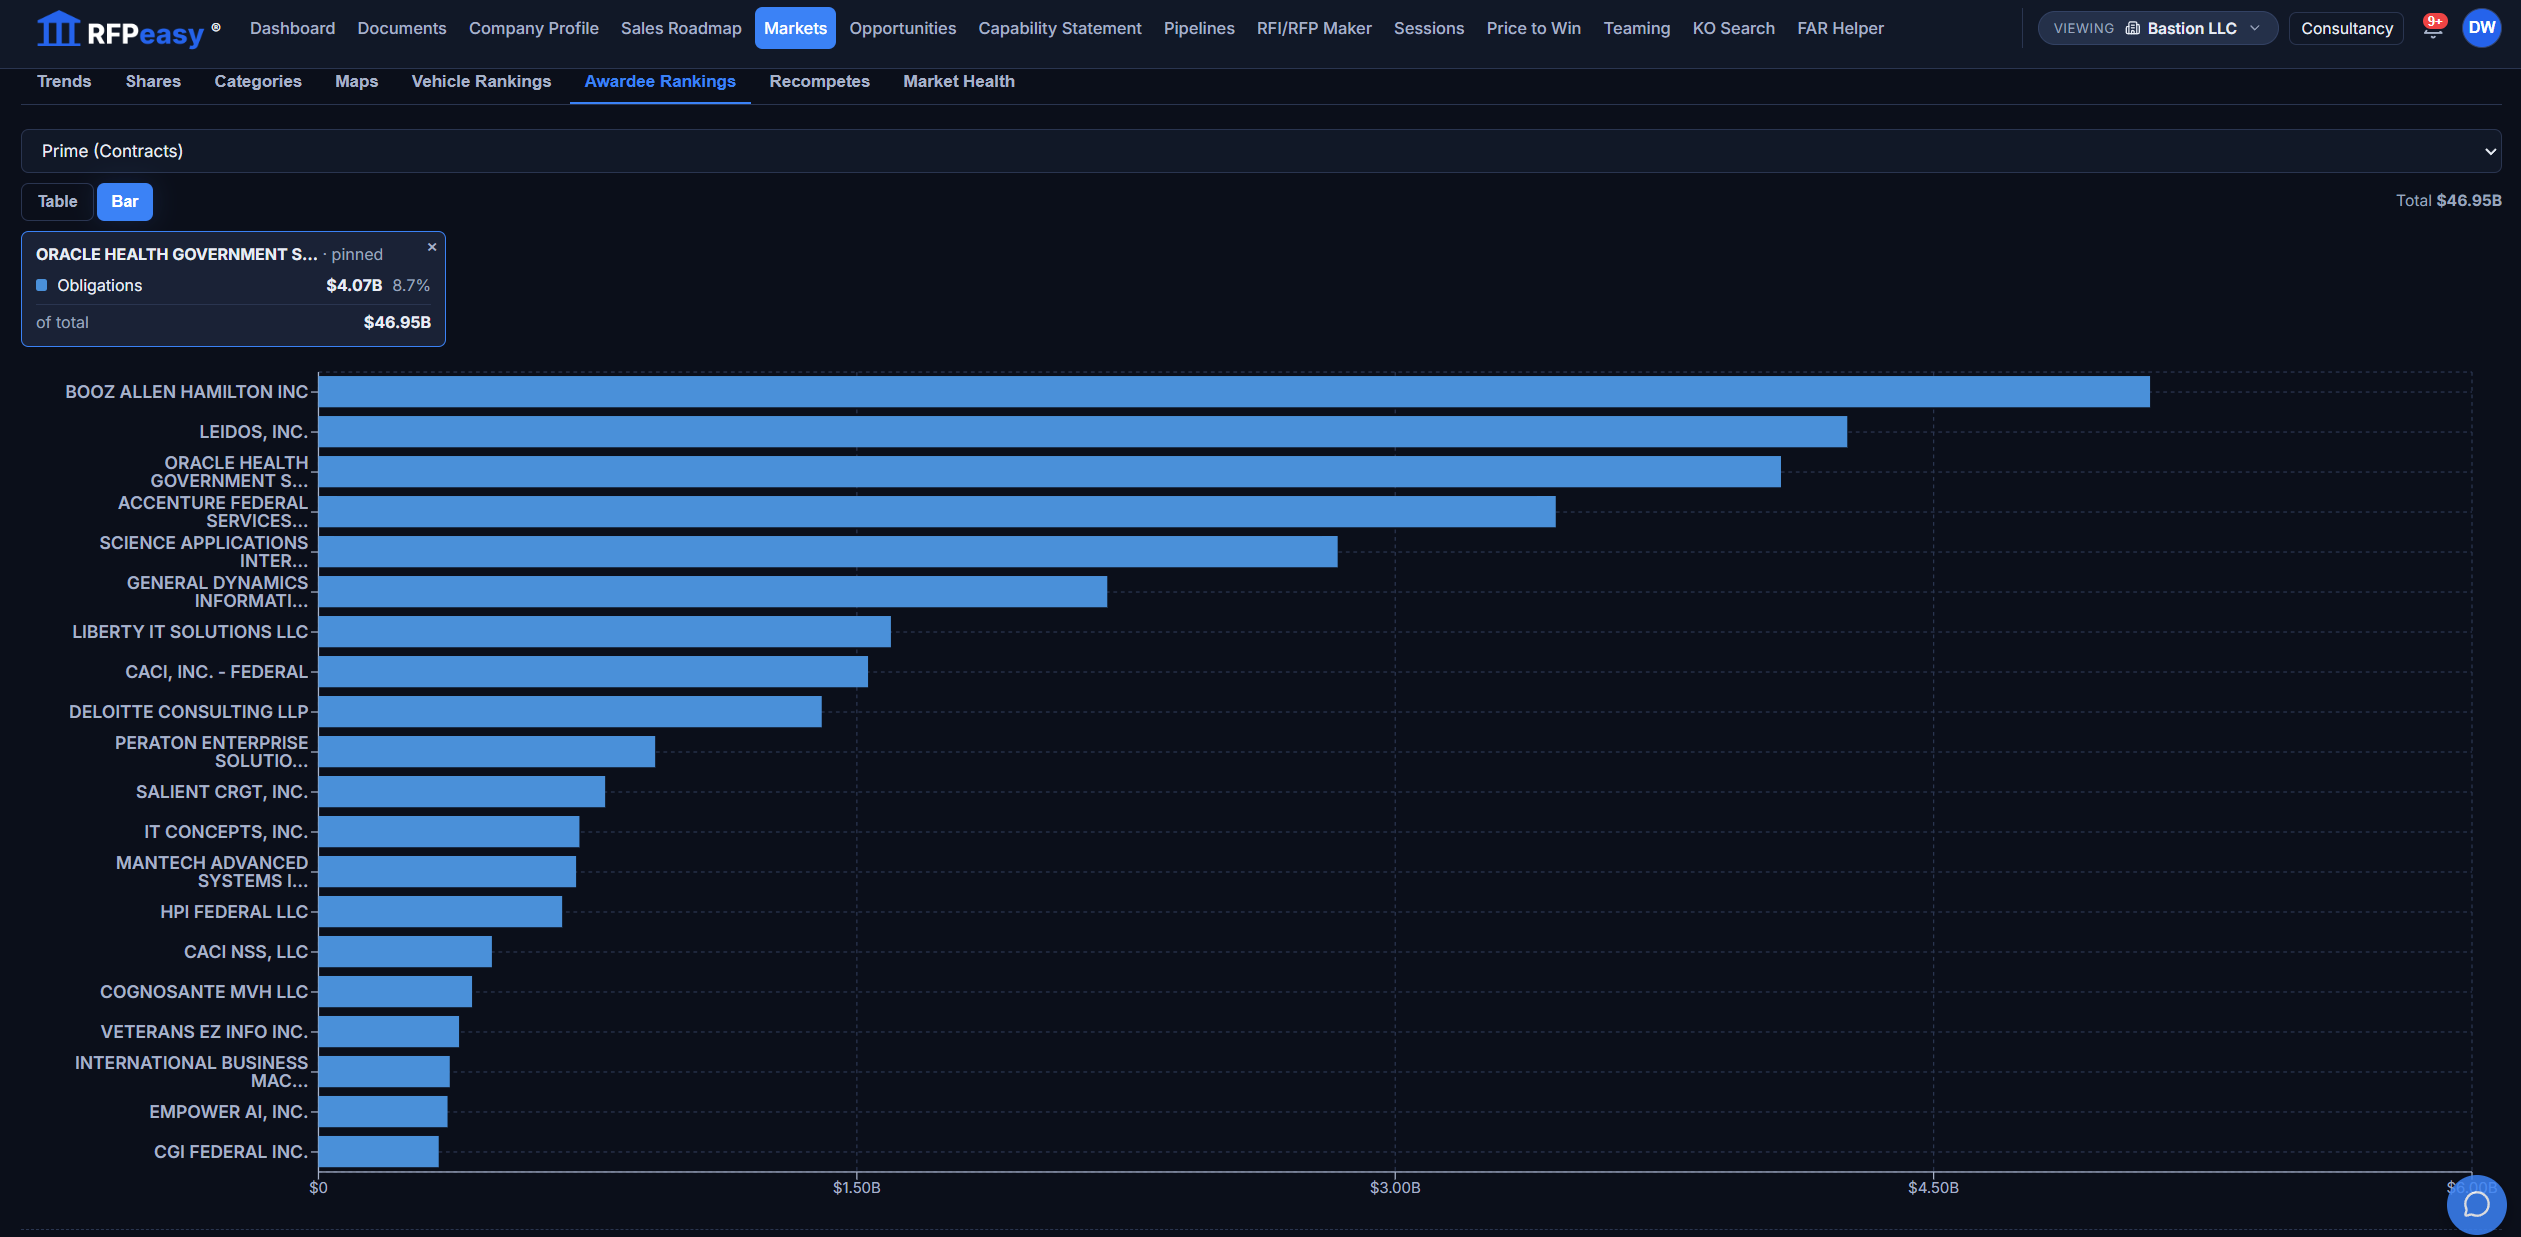
Every company competing in your market, ranked.
In NAICS 541512 that is 3,755 companies competing for $174.44B across 186,940 transactions, and the ranking shows every one that matters, primes and subcontractors both. The chart shows the leaders; the export contains all 3,755, not the top of the chart.
The expirations are the pipeline.
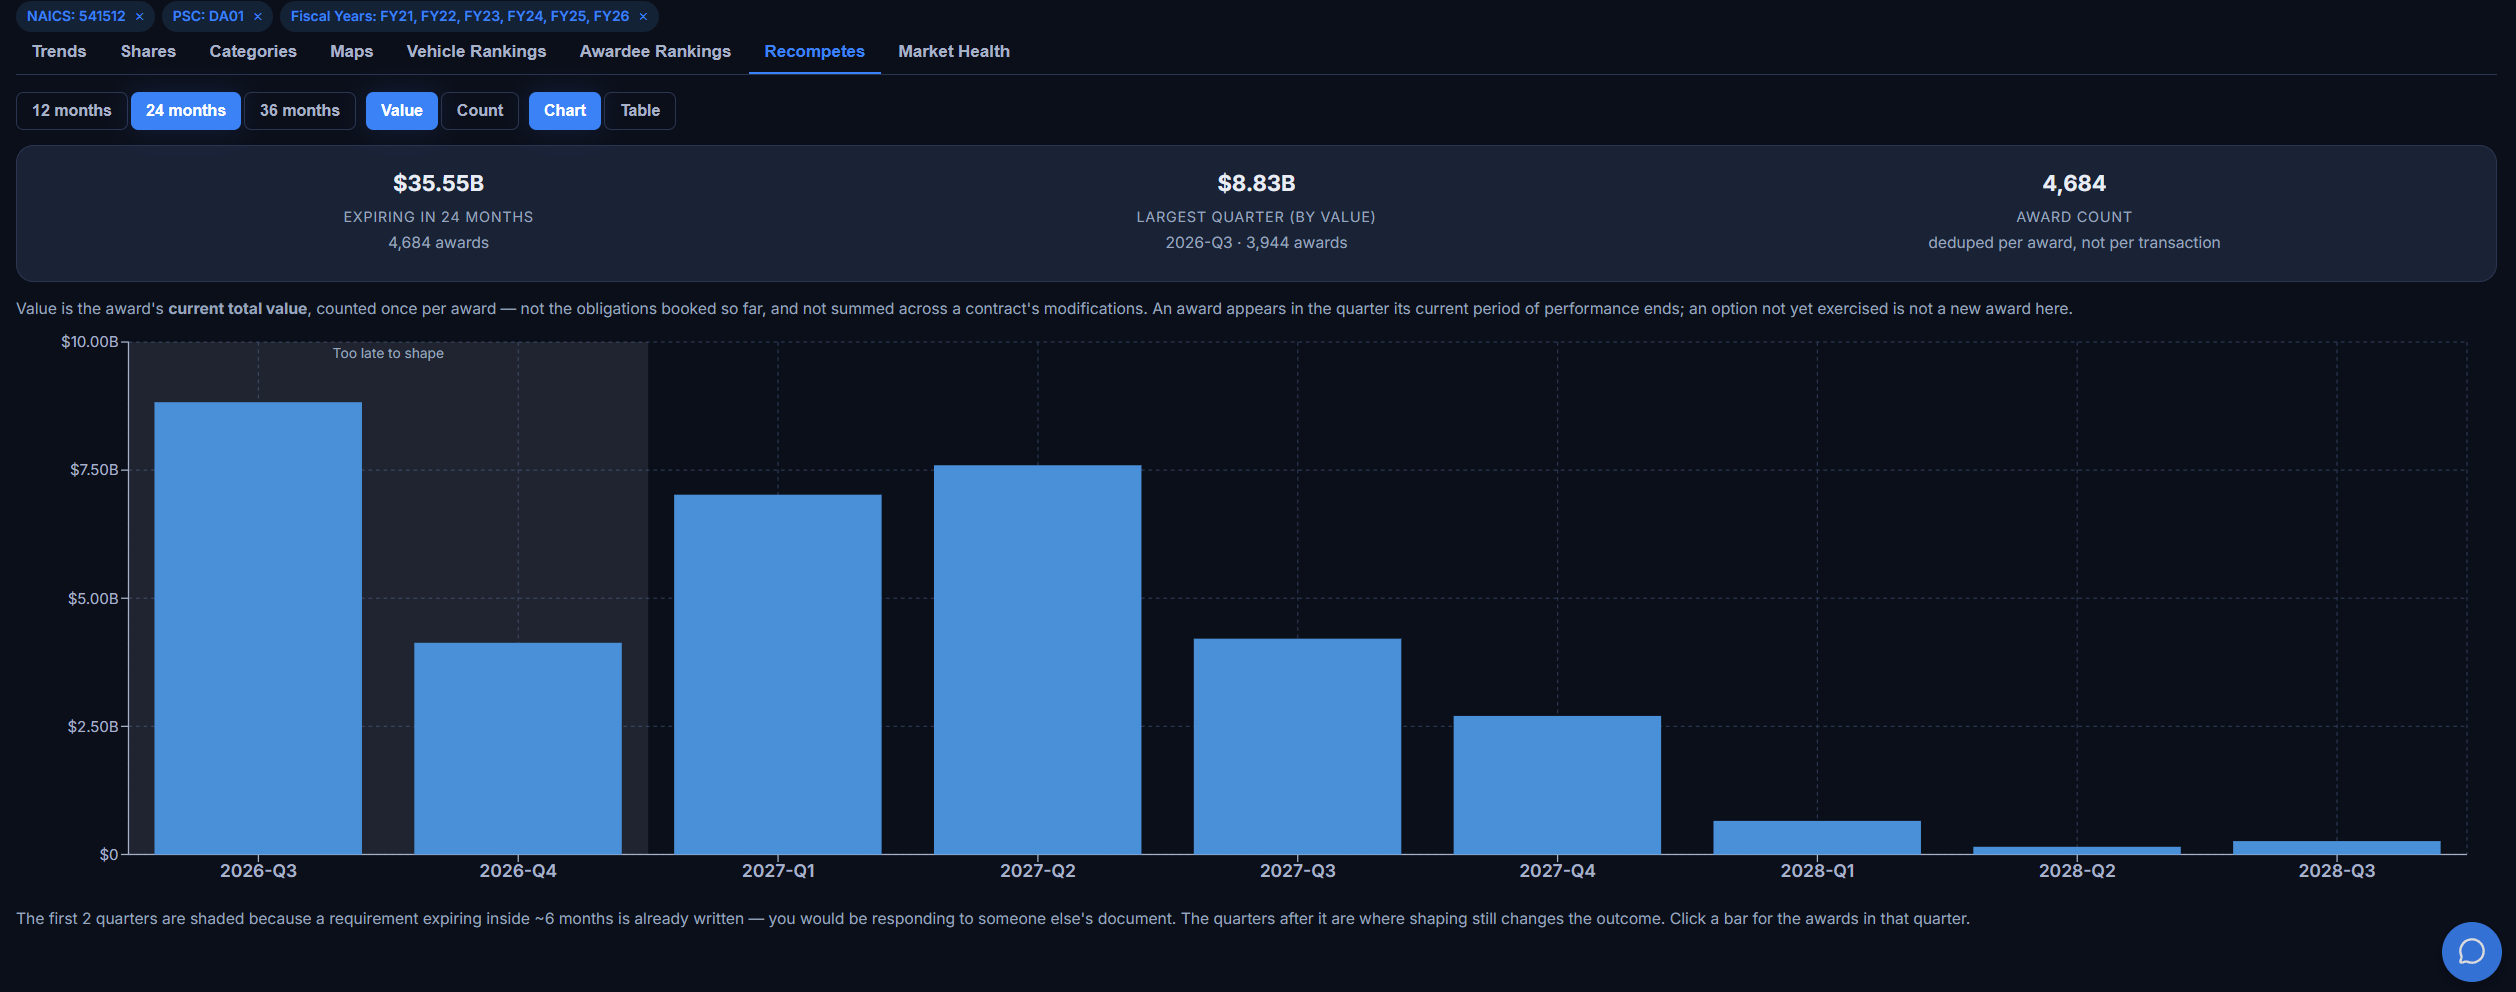
Every award in the market plotted by the quarter its period of performance ends. In NAICS 541512, 8,125 awards expire in the next 24 months. The first two quarters are shaded "too late to shape" because that requirement is already written; the quarters after it are where you can still change the outcome. Click a quarter for the call list: incumbent, contract, value, end date.
Where the work is actually performed.
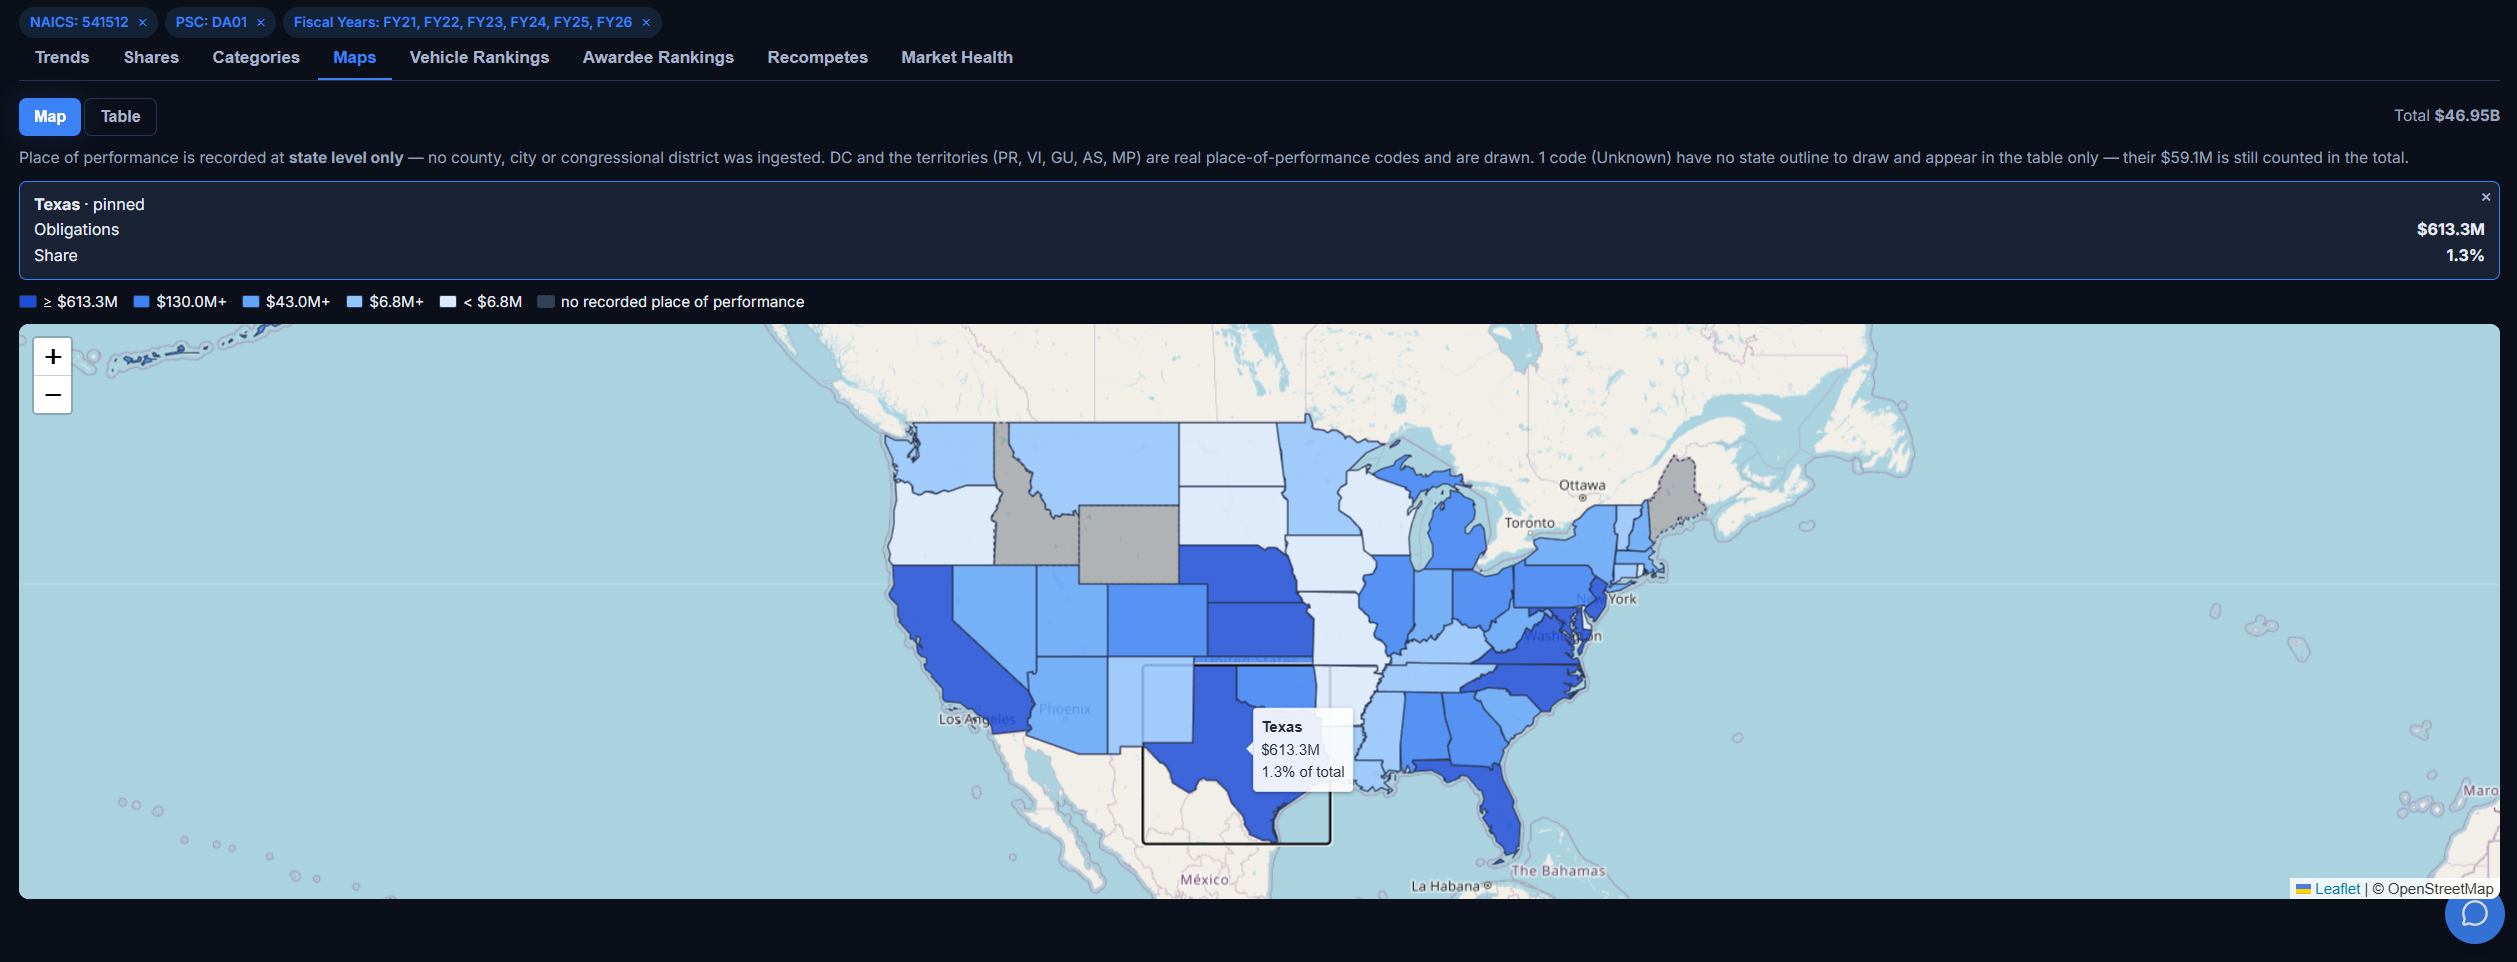
A state-level choropleth of the market’s place of performance. Pin any state for its exact dollars and share. The data is honest about its own grain: place of performance is recorded at state level, and the map says so rather than inventing county detail it does not have.
Which contracts the money rides on.
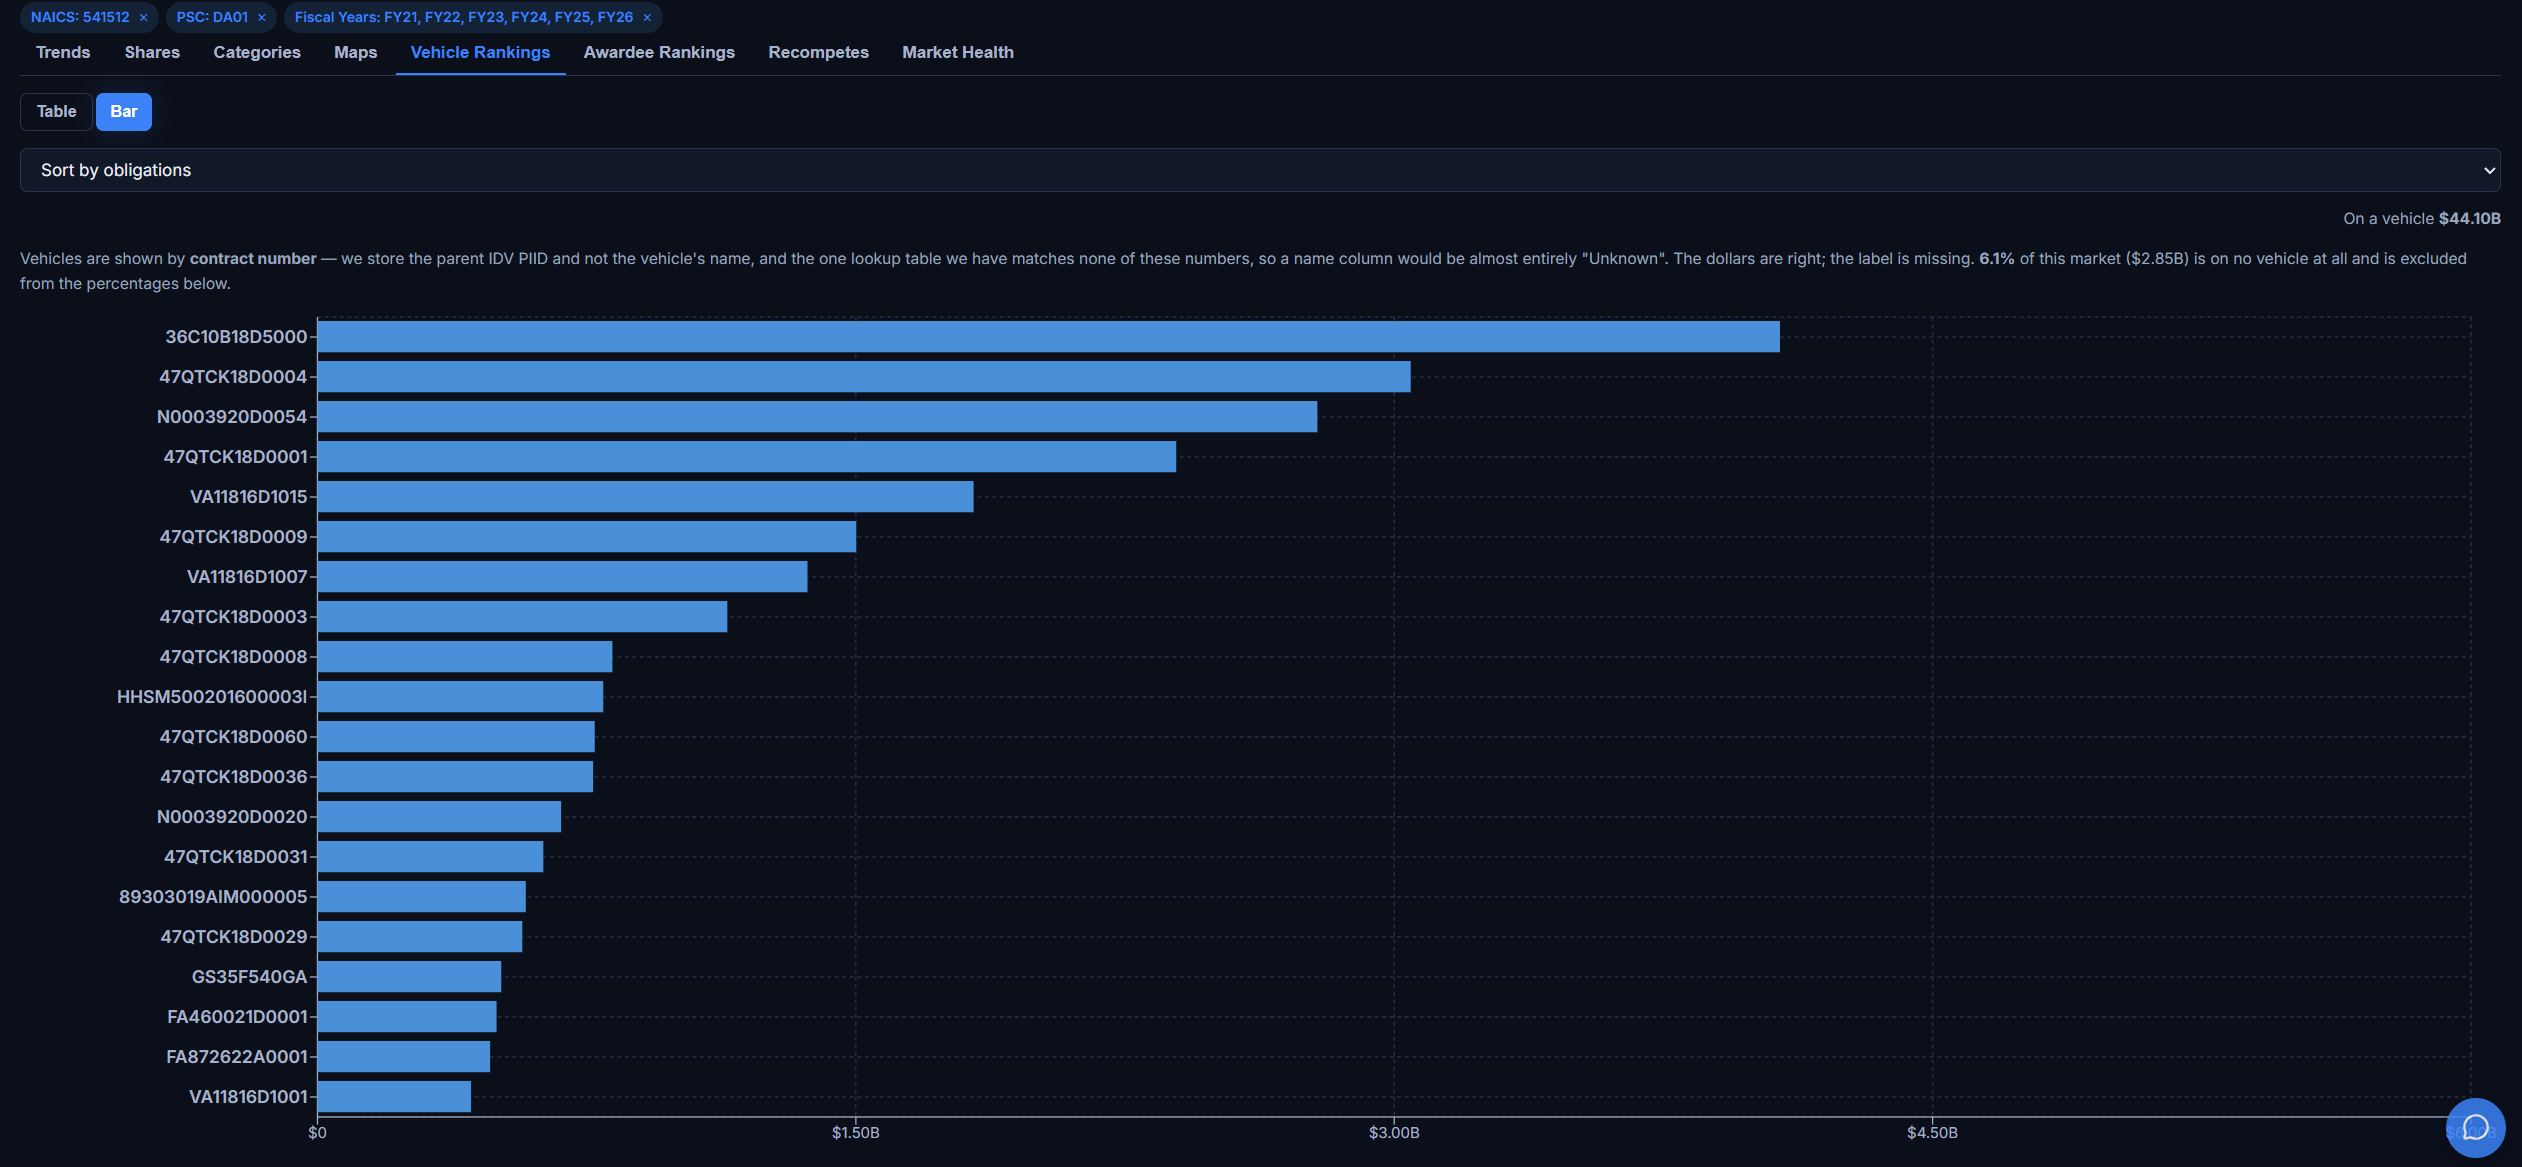
The parent vehicles carrying the market, ranked by dollars, so you know which IDIQs and GWACs to chase seats on before the next on-ramp. Where the government publishes no vehicle name, the view says so and shows the contract number rather than guessing.
Is this market open - or locked up?
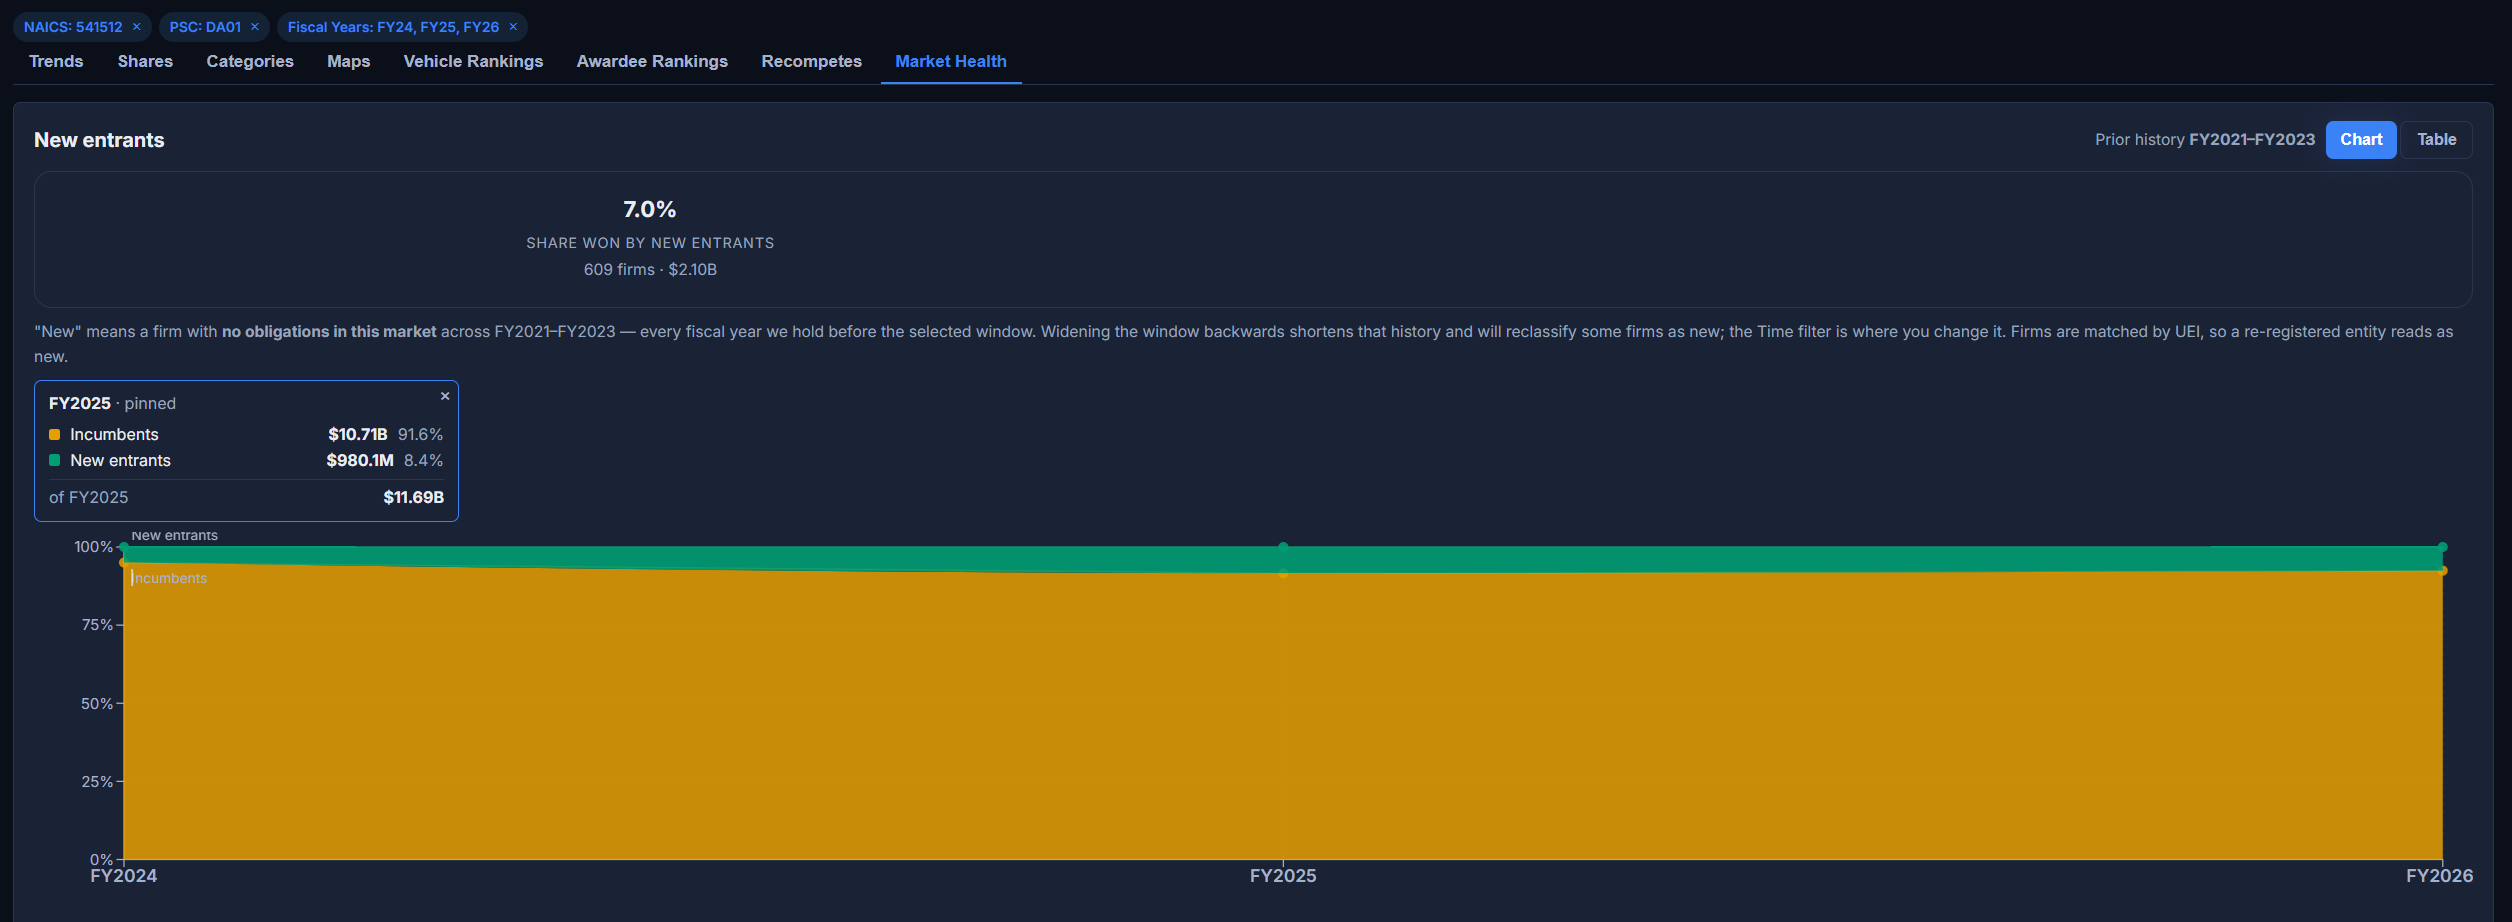
New entrants versus incumbents, year over year. What share of the dollars went to firms that had never won in this market before, and how many broke in. A market where nobody new ever wins is telling you something before you spend a dollar chasing it.
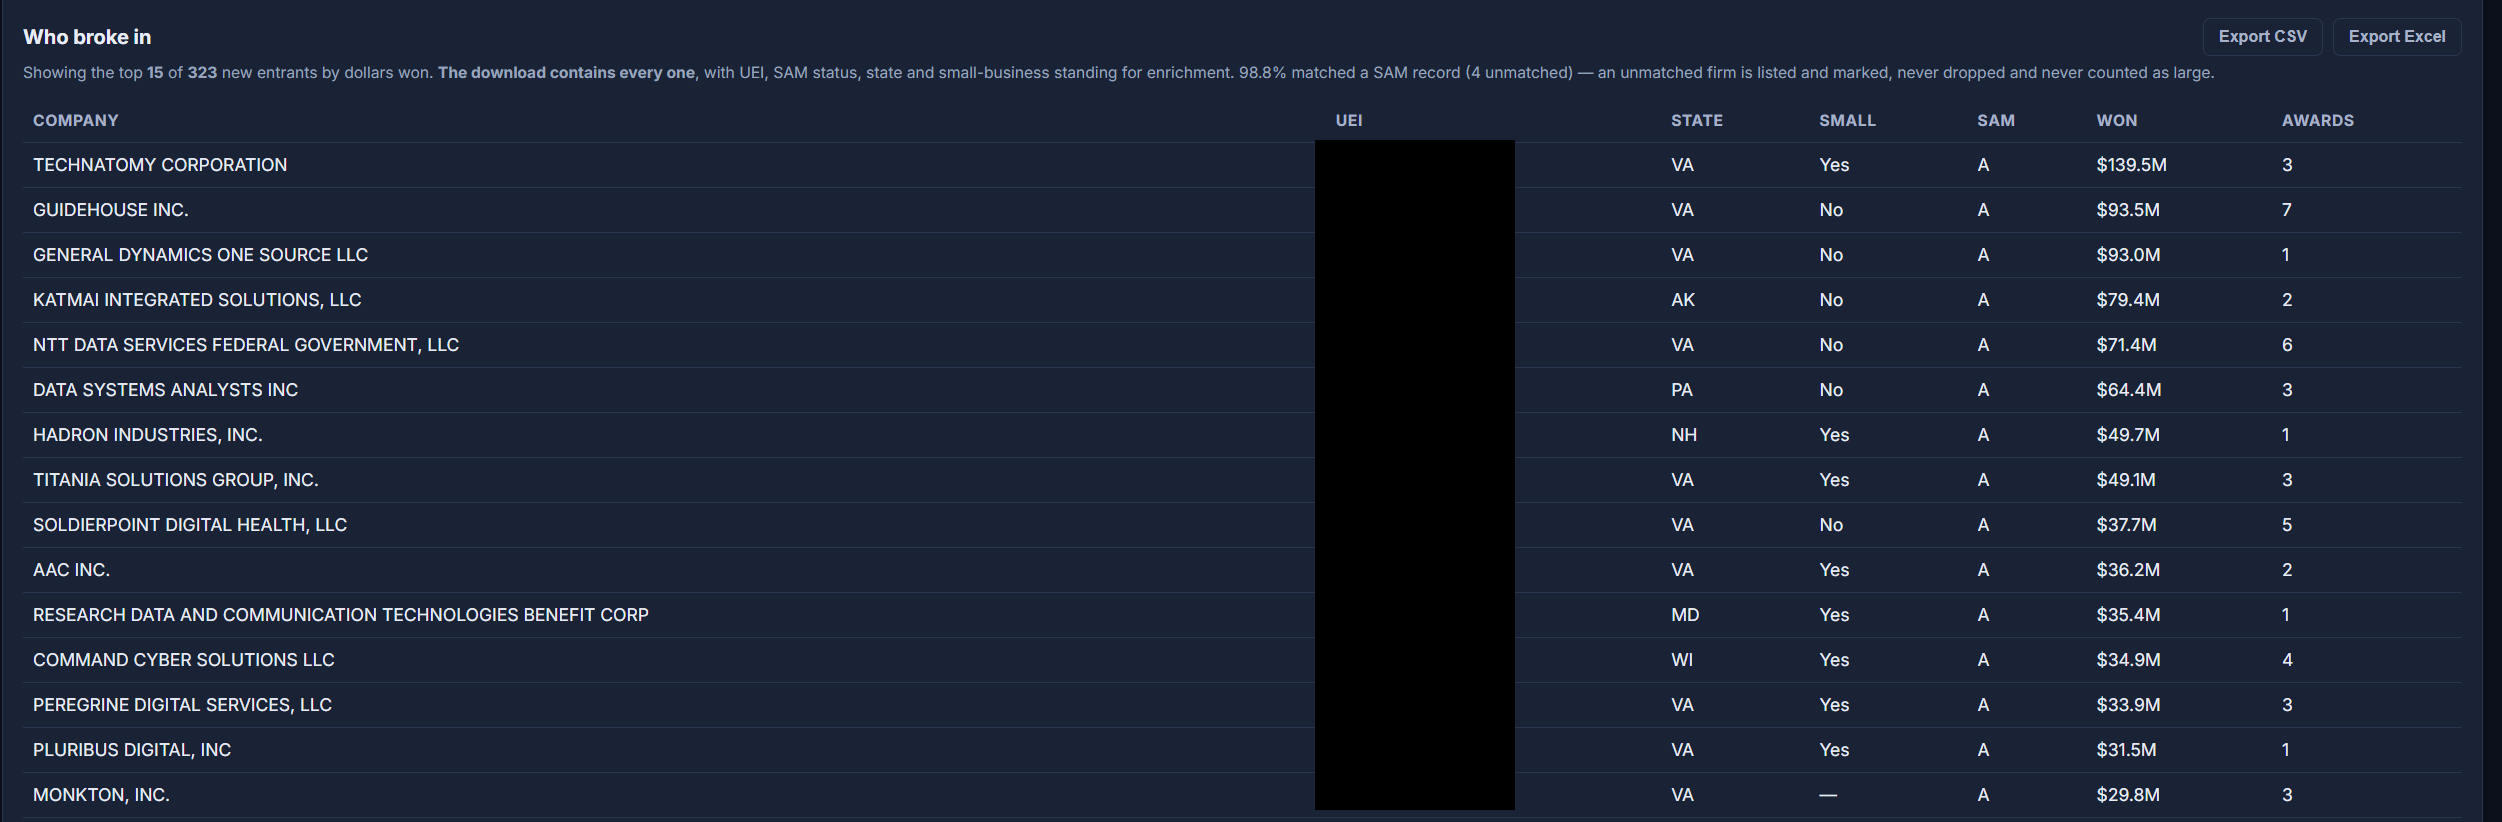
The newcomers, by name.
Every firm that broke into the market, ranked by dollars won, with state, SAM status, and small-business standing. If they got in, the door is open; now you know exactly who walked through it and how much they took.
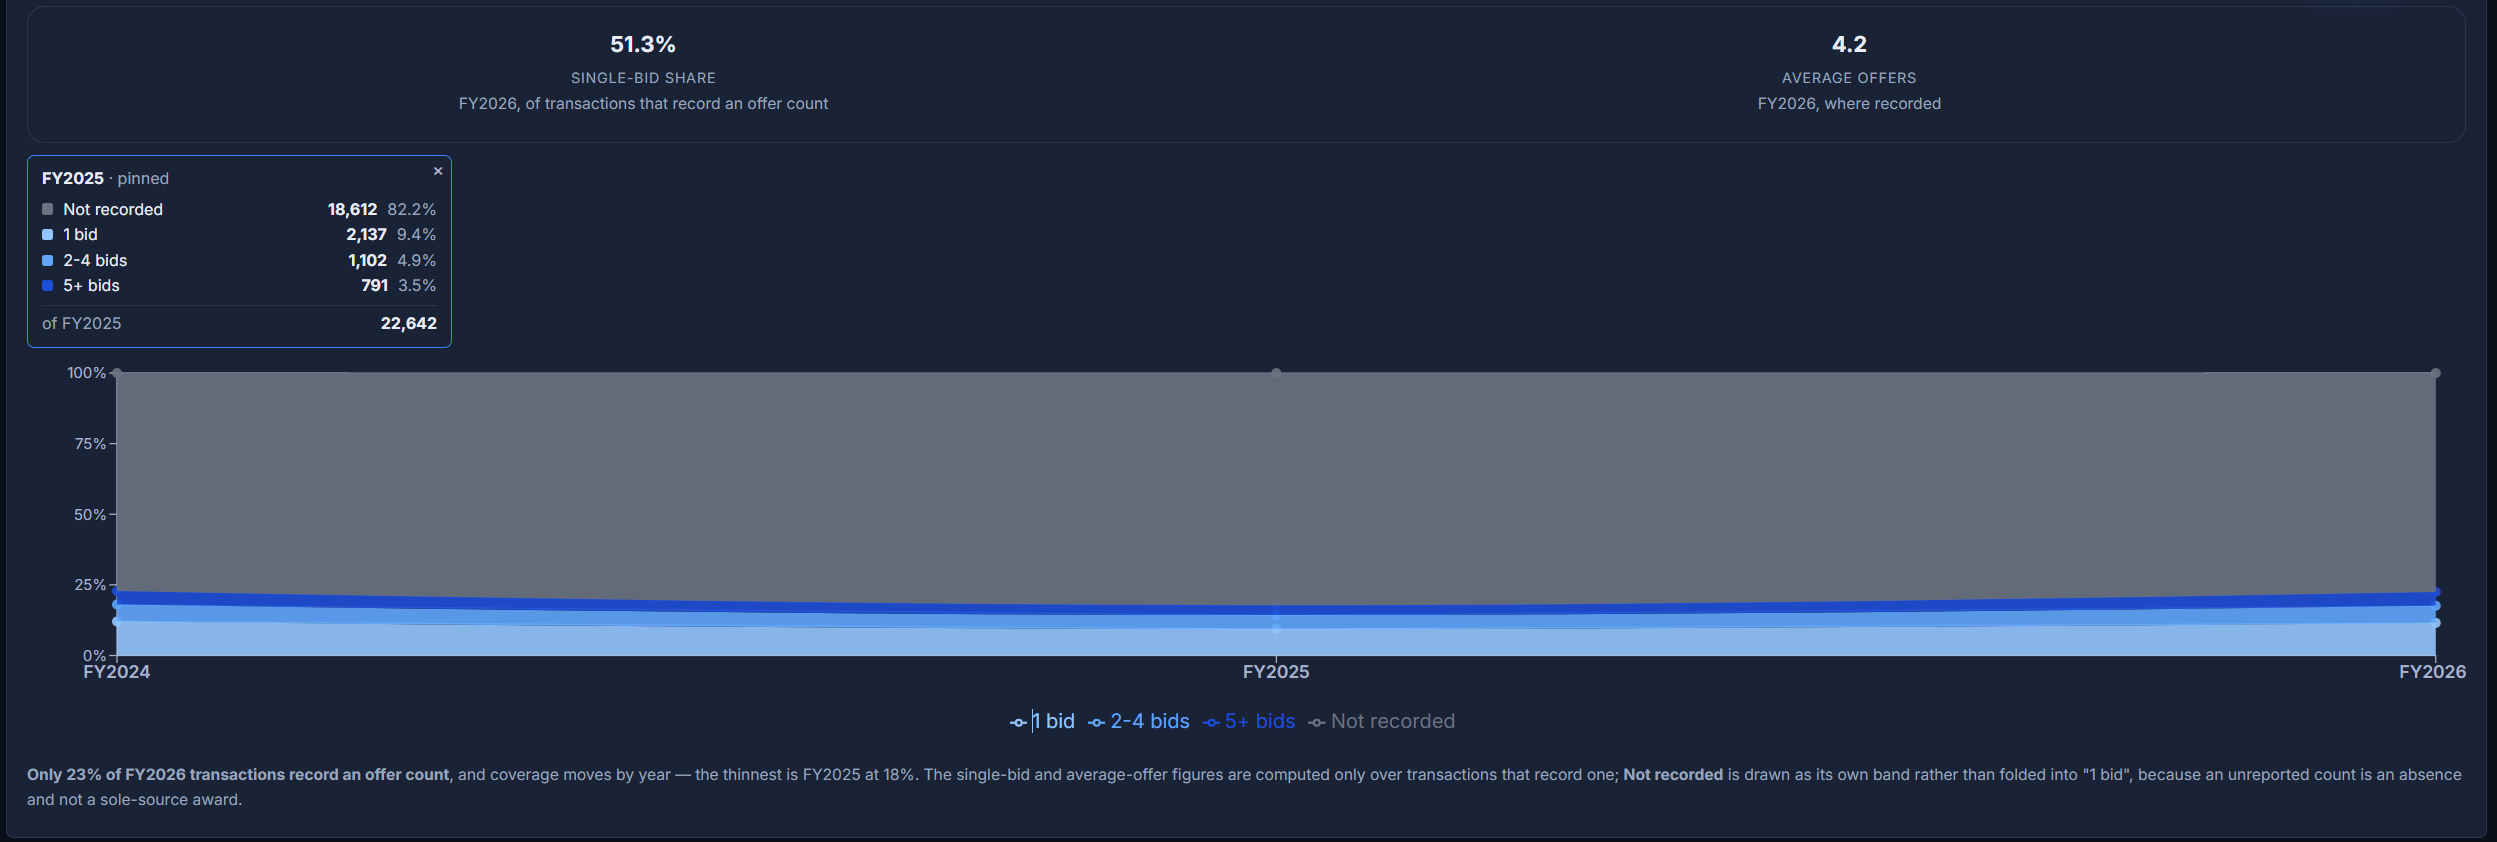
How contested is an award here, really?
Single-bid share and average offers per award, by year, computed only over transactions that record an offer count, with the coverage stated per year instead of hidden. Alongside it: dollars reserved in set-asides versus dollars small firms actually won, so the set-aside story is measured, not assumed.
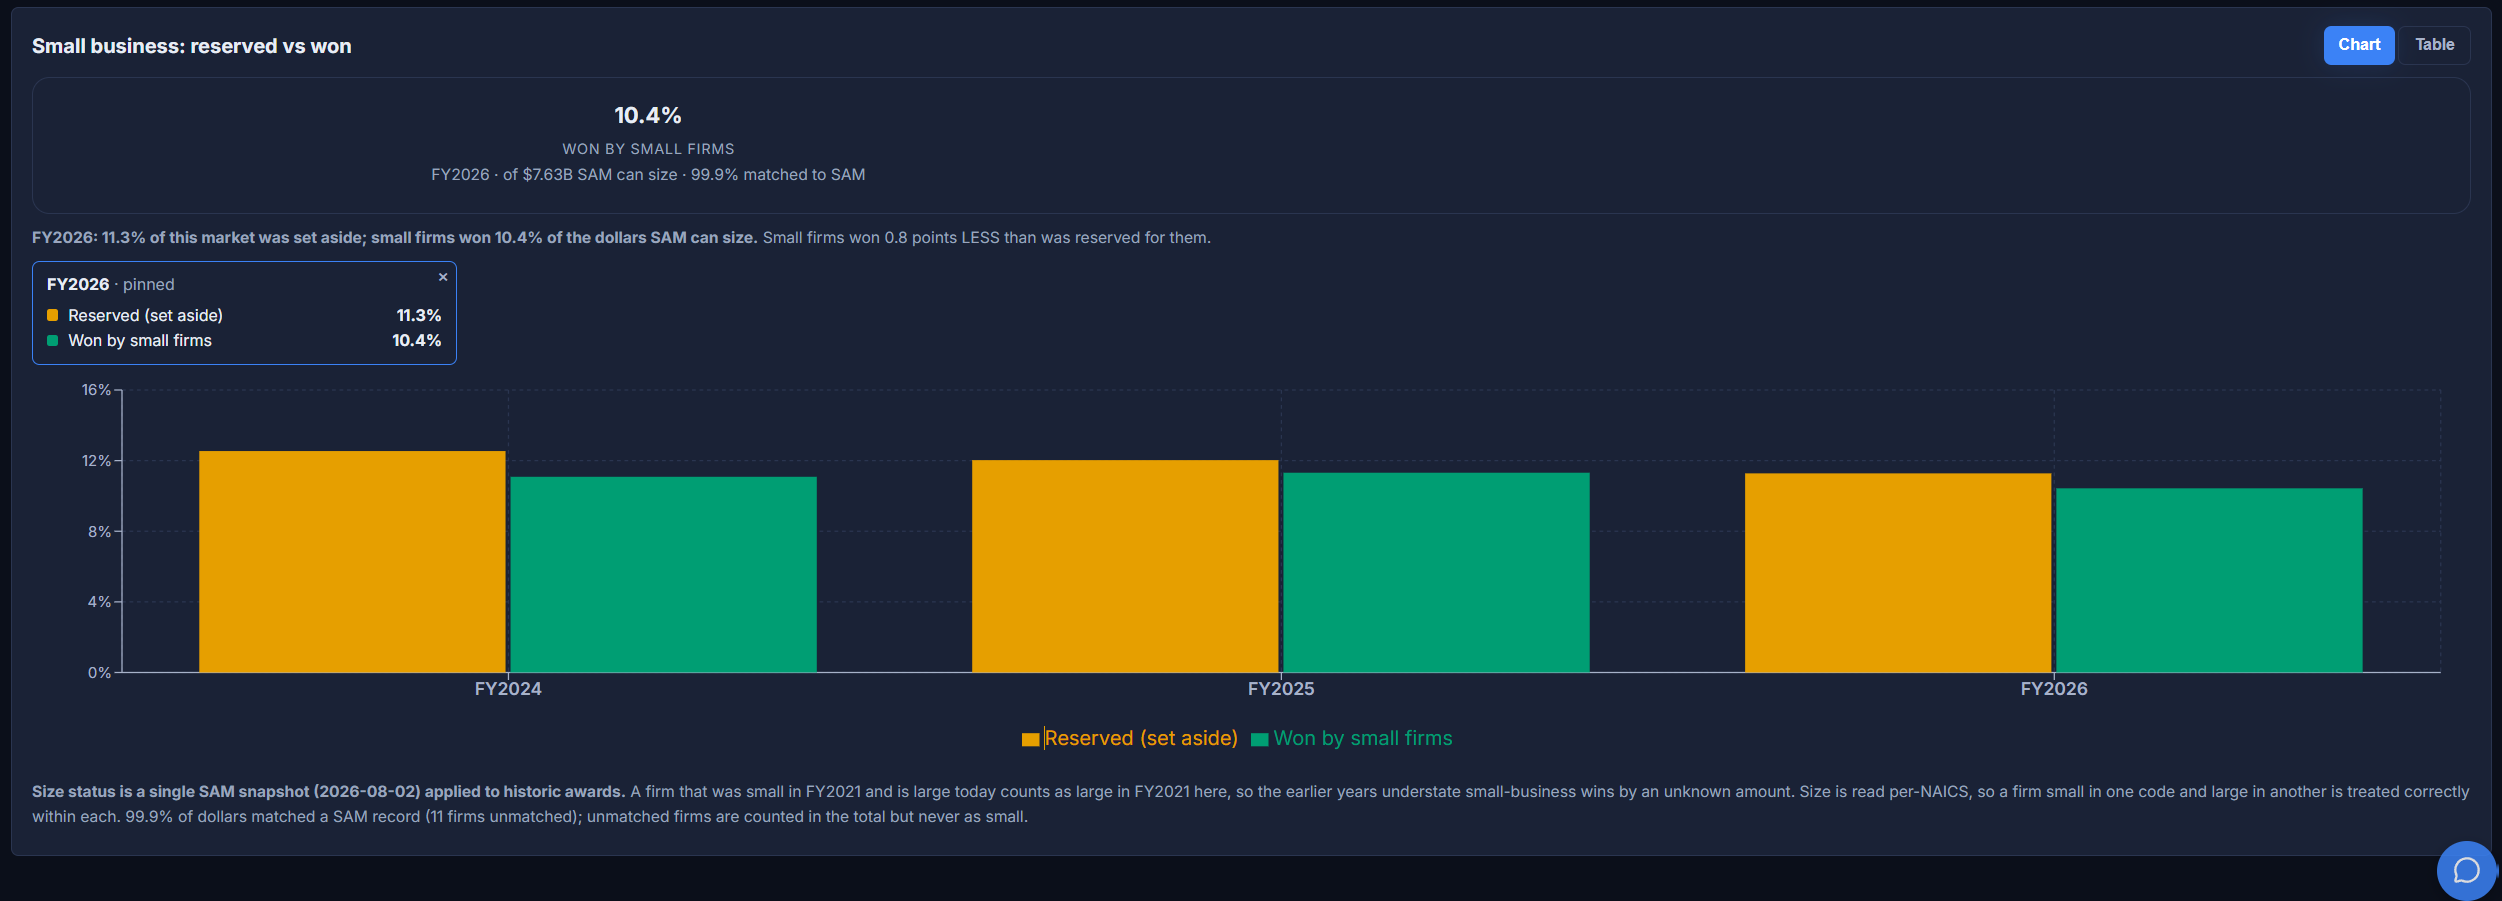
Reserved versus won: the gap, in points.
What share of the market was set aside for small business, next to what small firms actually won, per year, with the gap stated in a sentence you can repeat in a strategy meeting. Where SAM publishes no size standard for a code, the panel says so instead of printing a zero.
Every view exports complete. Not the top of the chart. The market.
CSV, Excel, PNG, or straight to your clipboard, from one Export control on every view. The file is the complete set: the Awardee export is all 3,755 firms in the market, not the 25 the chart has room to draw. You keep what you find.
Bring your NAICS to a demo and we’ll run it live, and you keep whatever we find, whether or not you ever buy anything.
Once you can see the market, work it.
Markets tells you where the money is, who holds it, and when it comes loose. The rest of RFPeasy is how you go get it.
- Company ProfileYour primary NAICS is the natural first market to run.
- Sales RoadmapTurn the market you just explored into a board-ready deck.
- OpportunitiesWatch the live solicitations in the markets you chose.
- Teaming Partner FinderThe incumbents and newcomers you just ranked are the teaming map.
Stop researching your market. Run it.
Eight views, seventeen filters, FY2021-FY2026, built from 35.9M prime award transactions. Bring a NAICS code and see your market in the first five minutes.